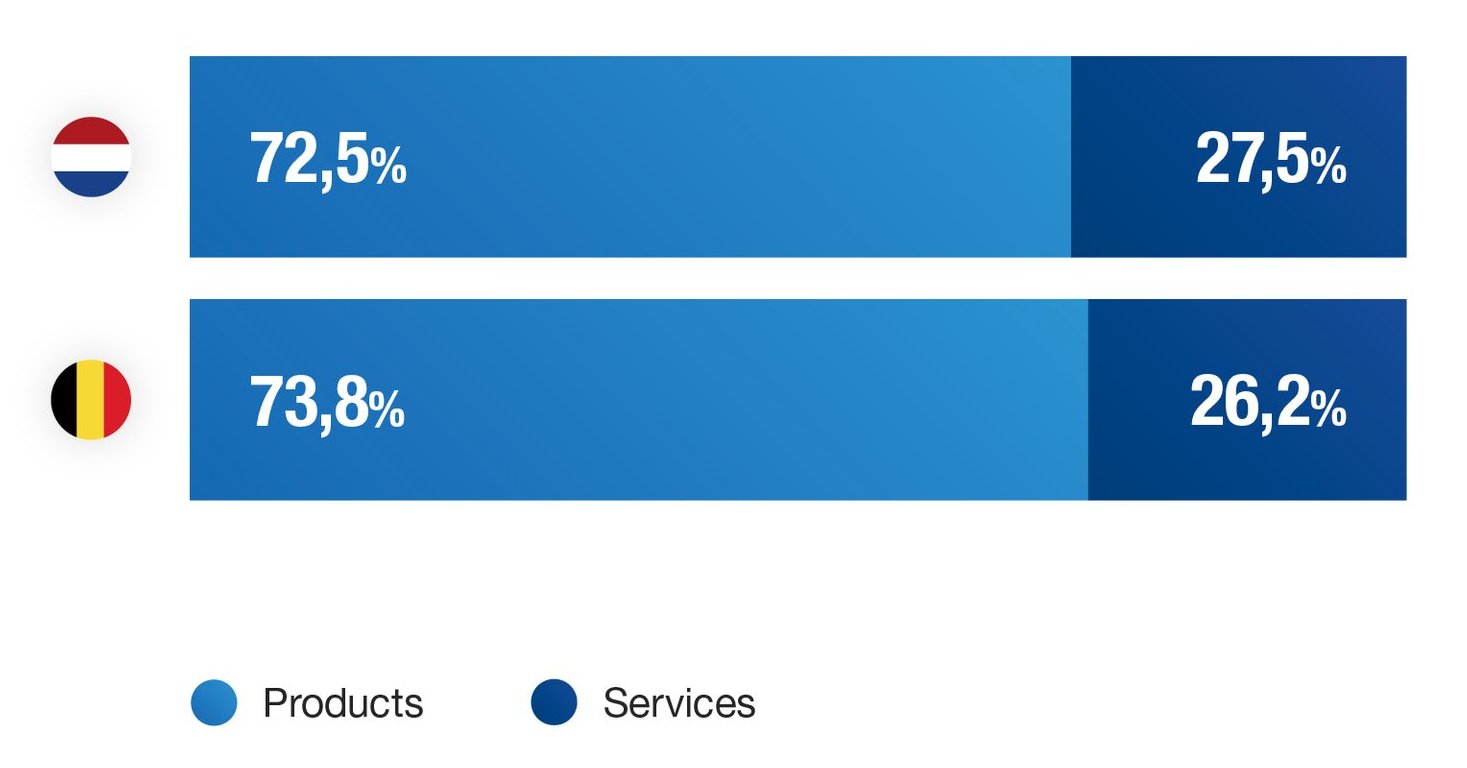
When it comes to Buyer Journey Complexity in the Netherlands compared to Belgium, the numbers tell an interesting story.
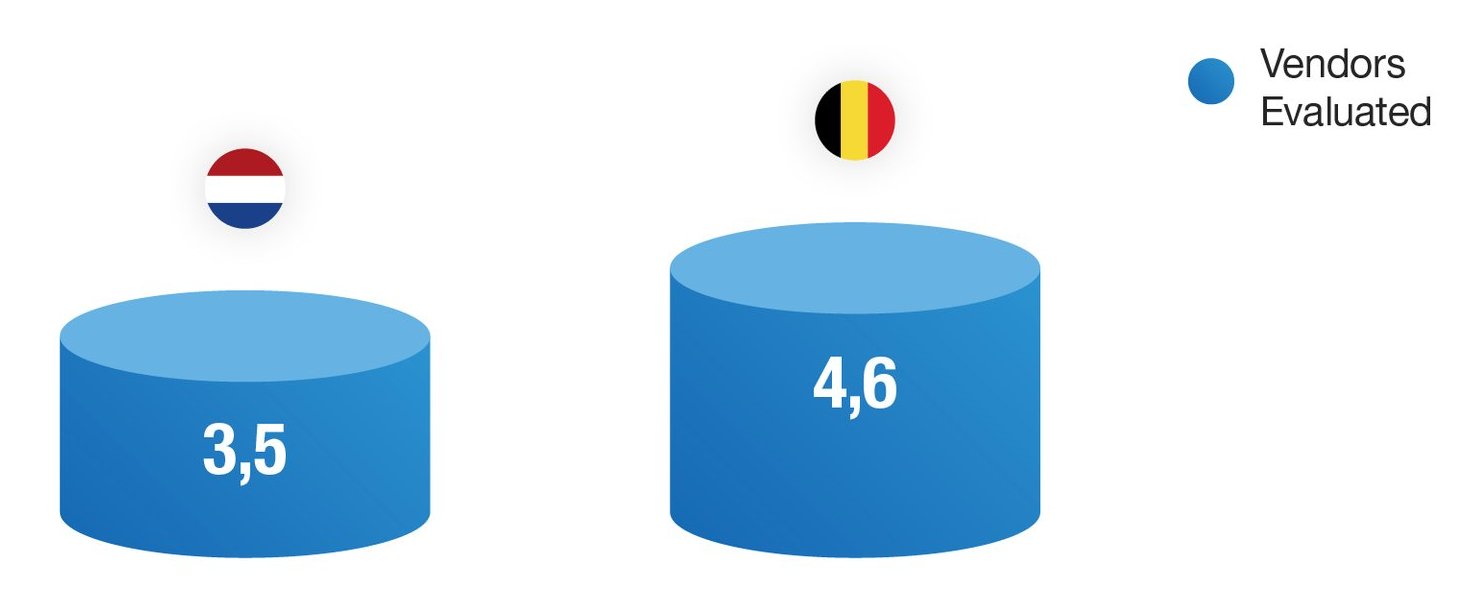
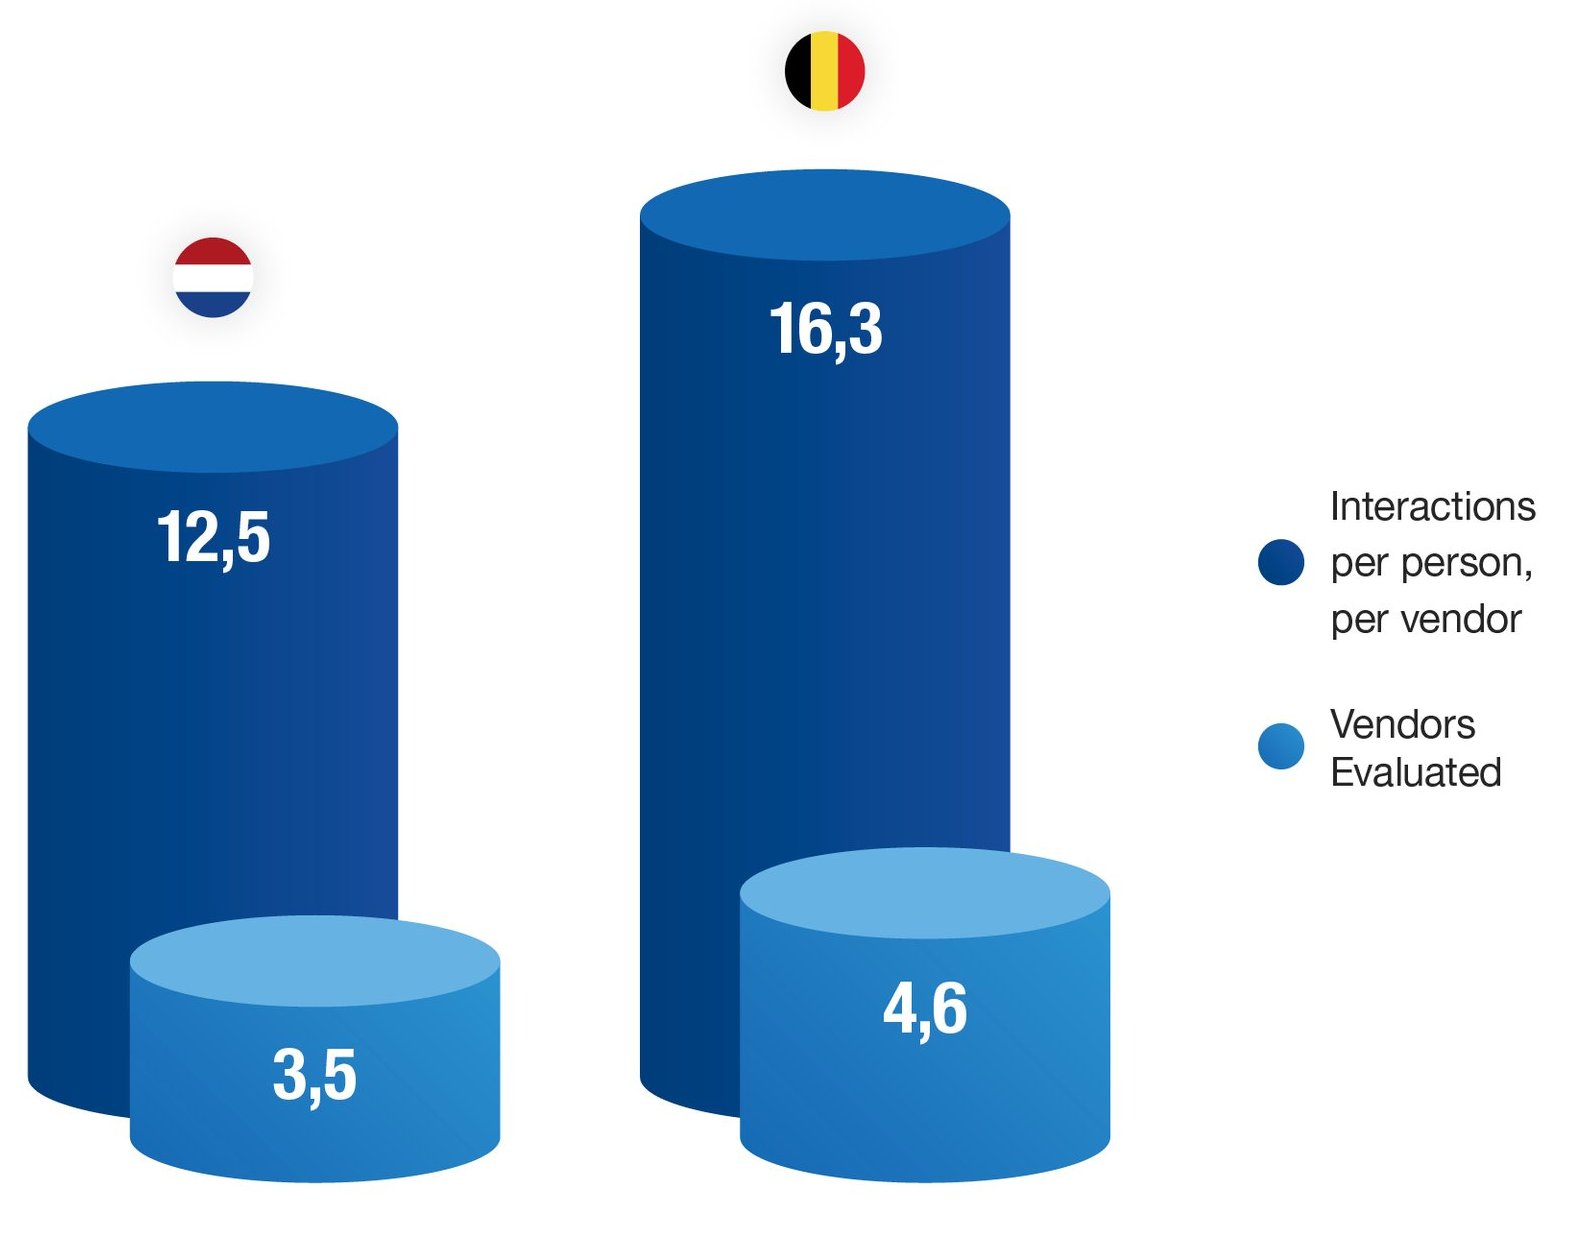
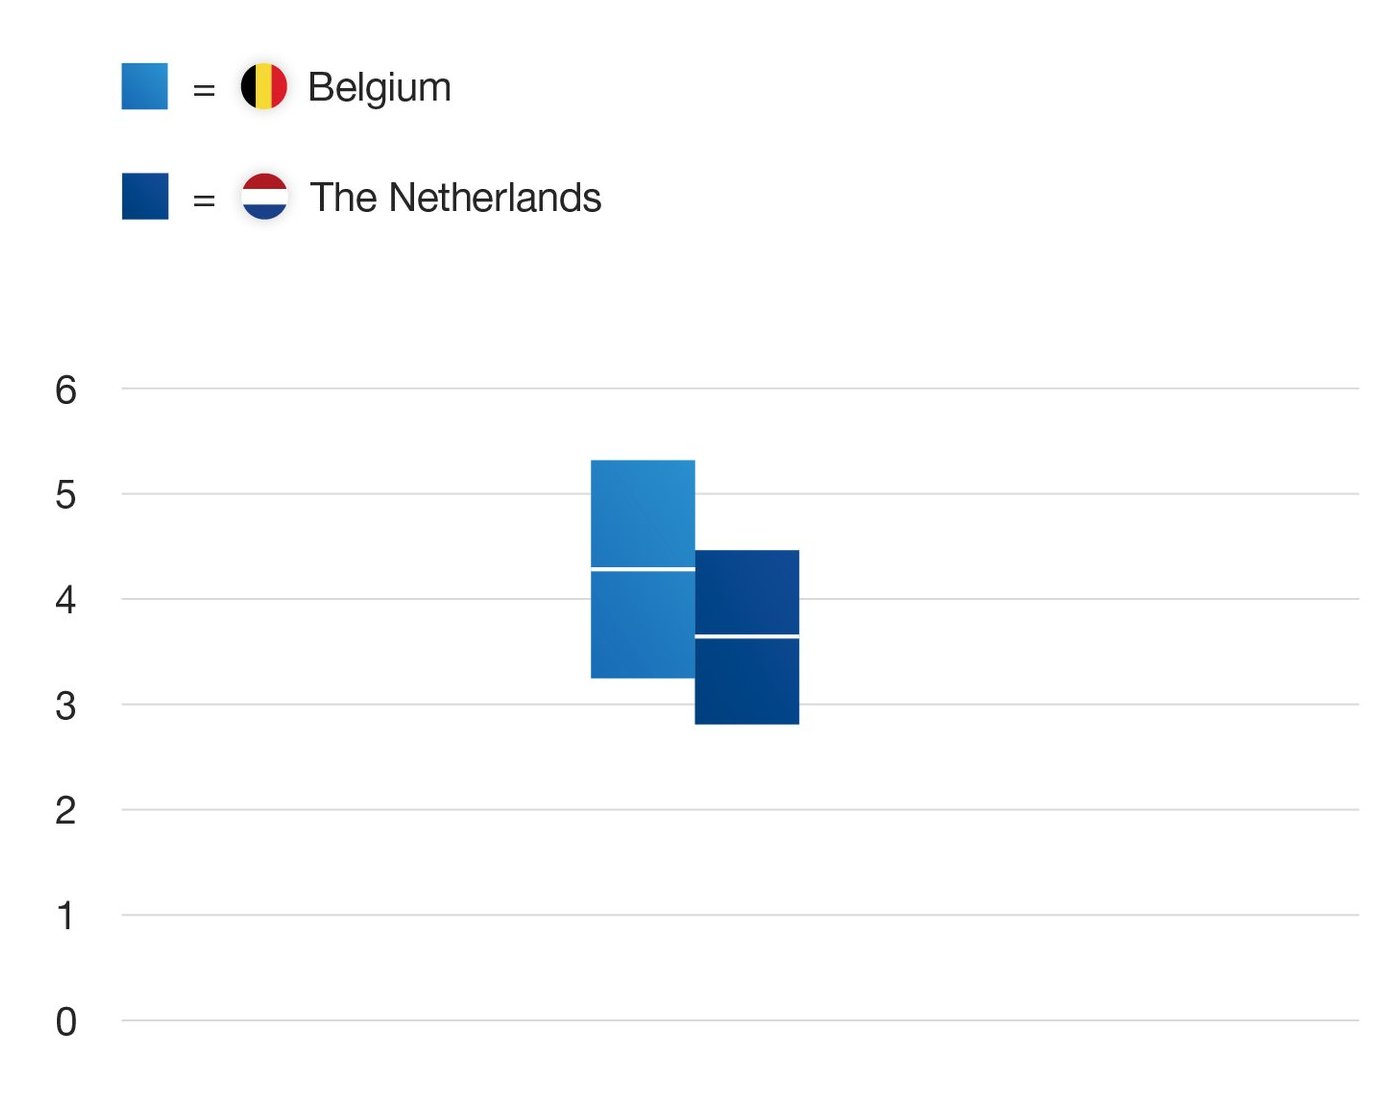
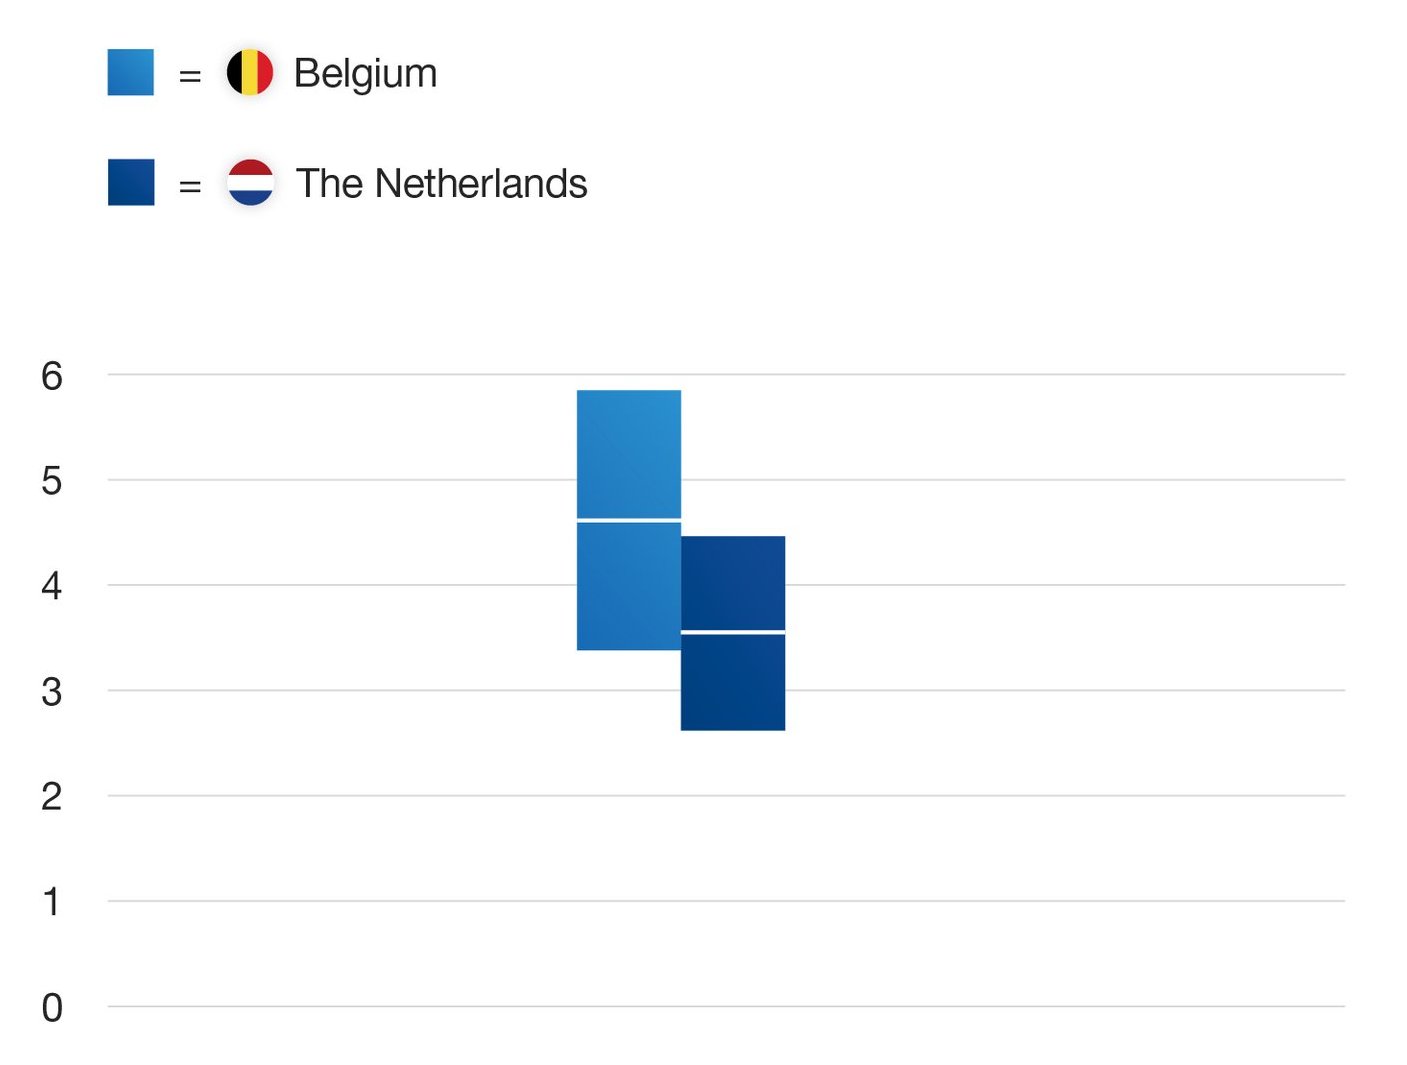
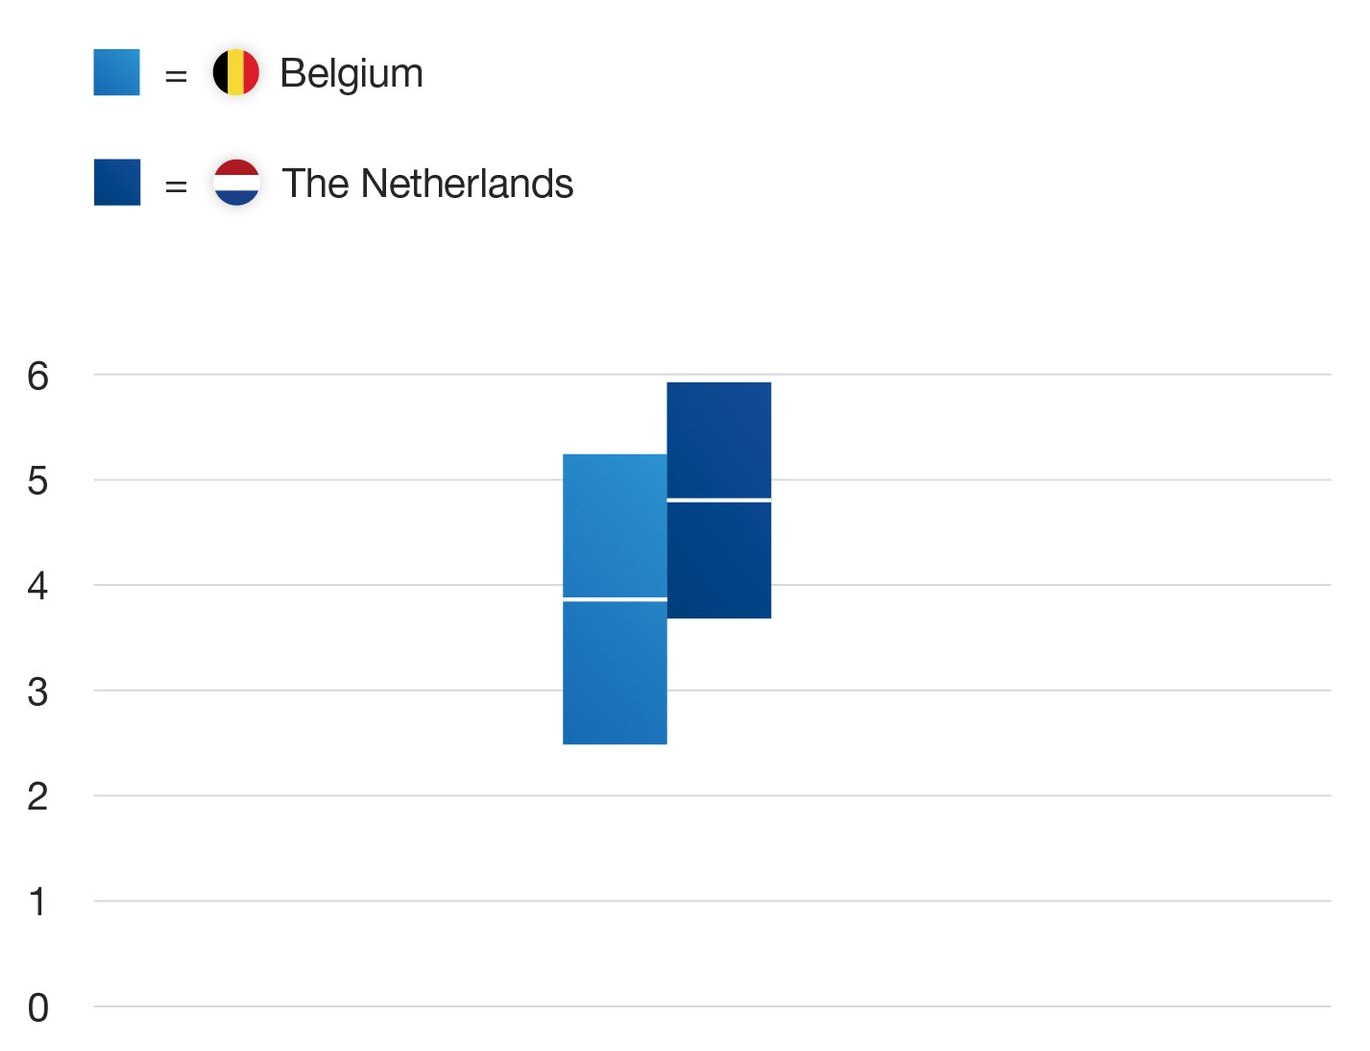
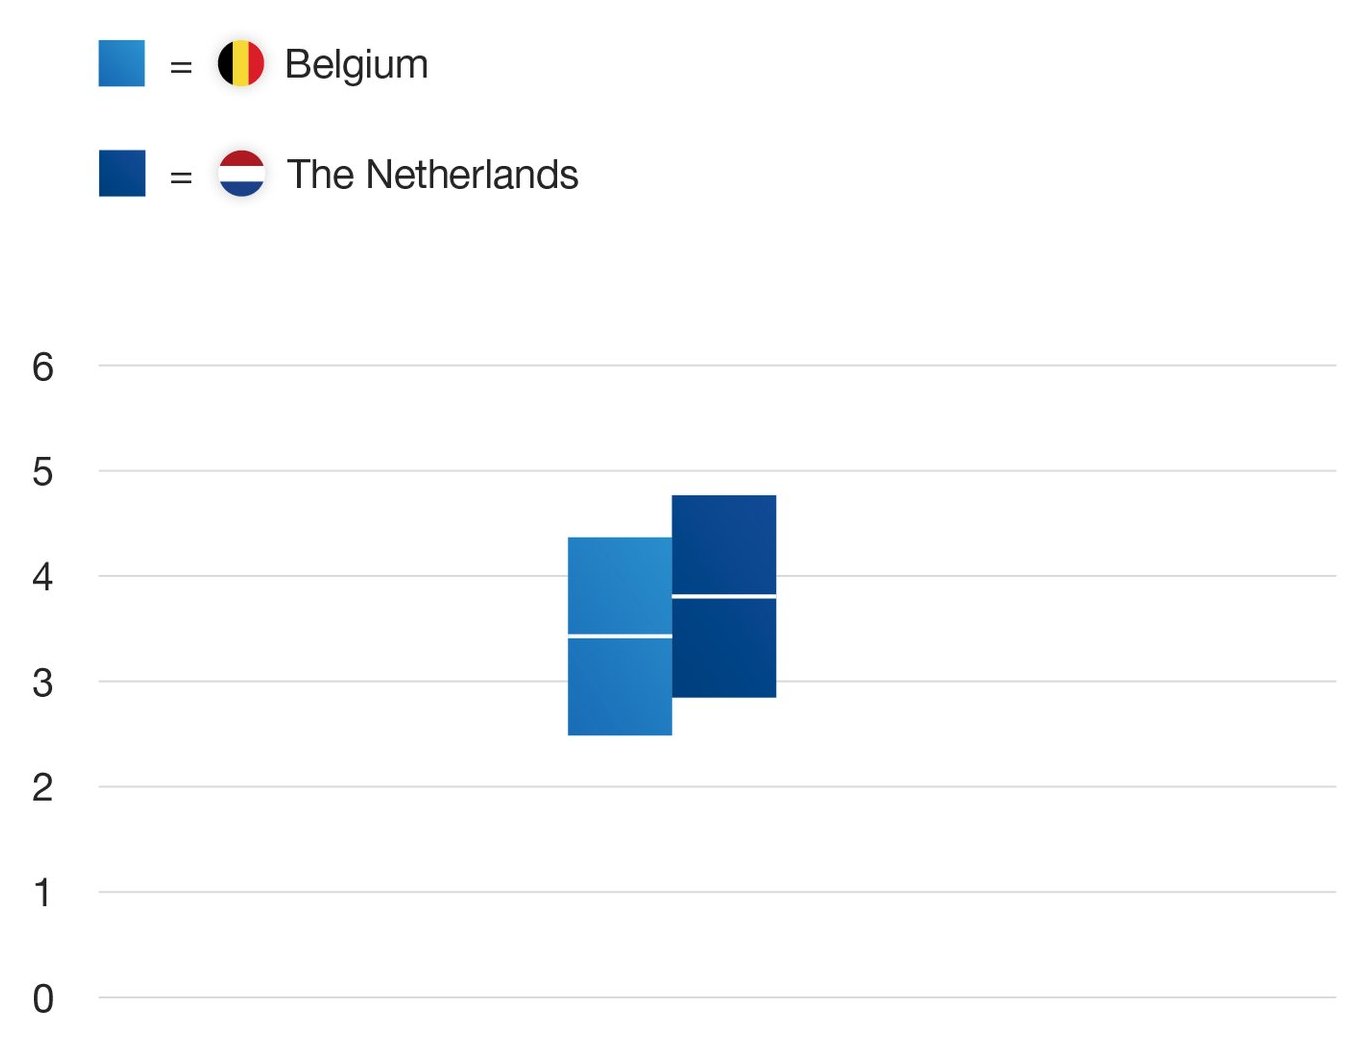
As seen in Figure 4, Dutch buying groups tend to evaluate fewer vendors—around 3.5 on average—compared to Belgium’s 4.6.
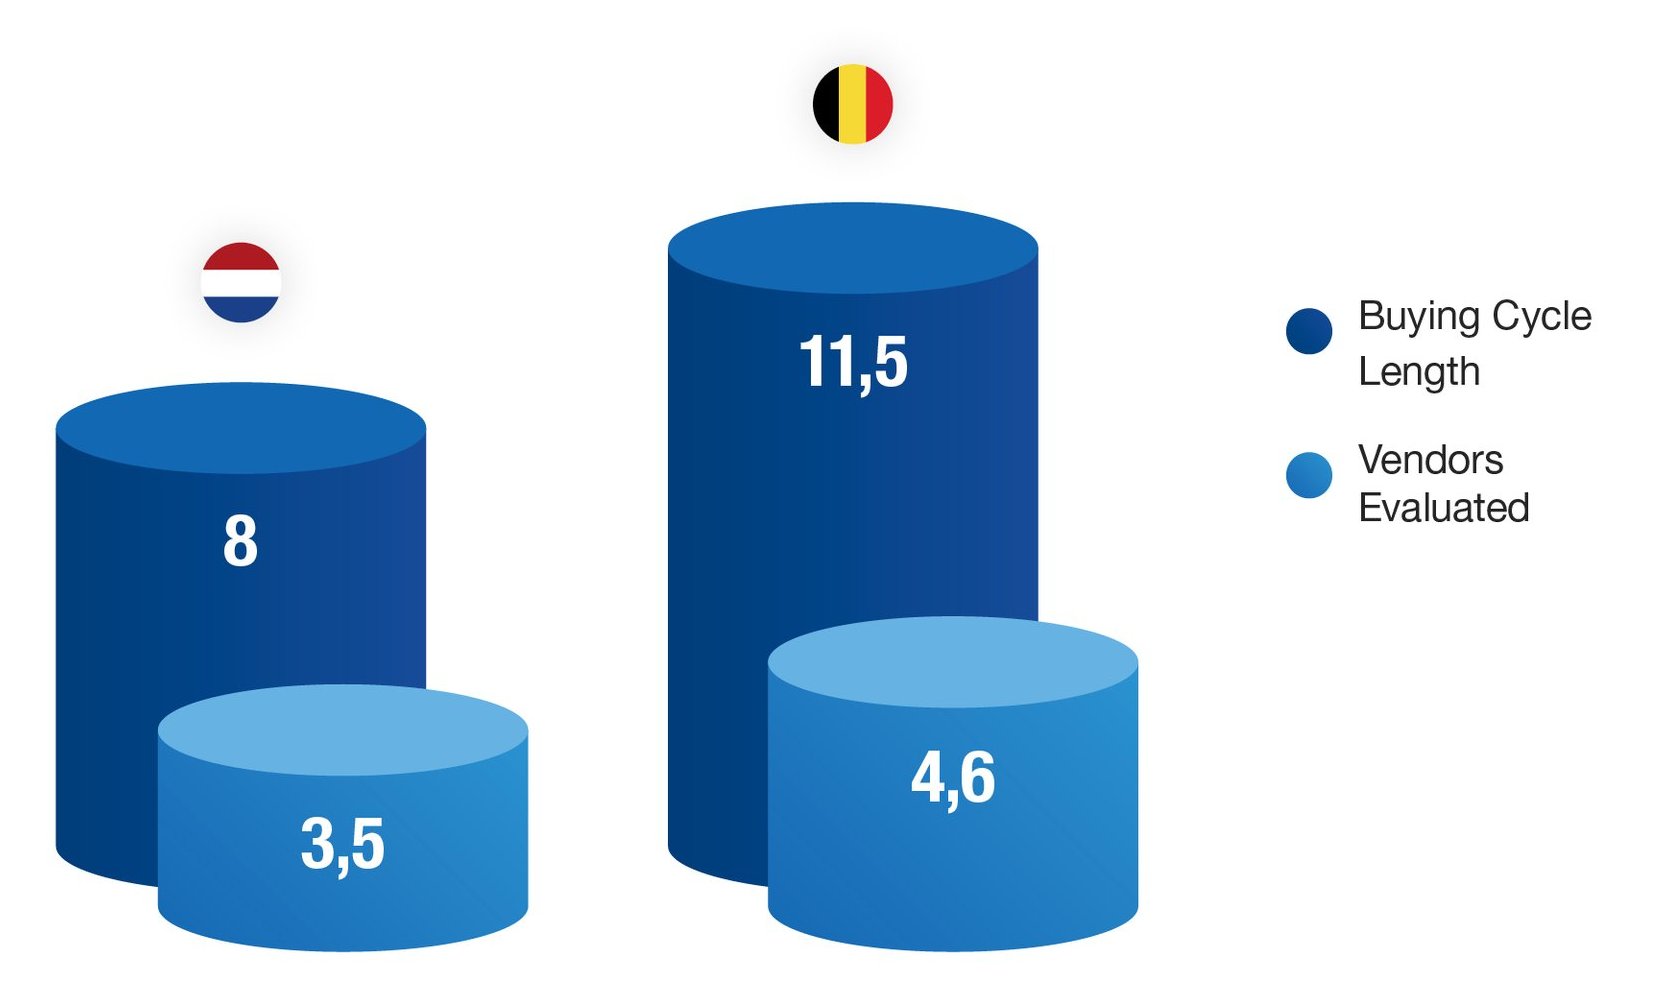
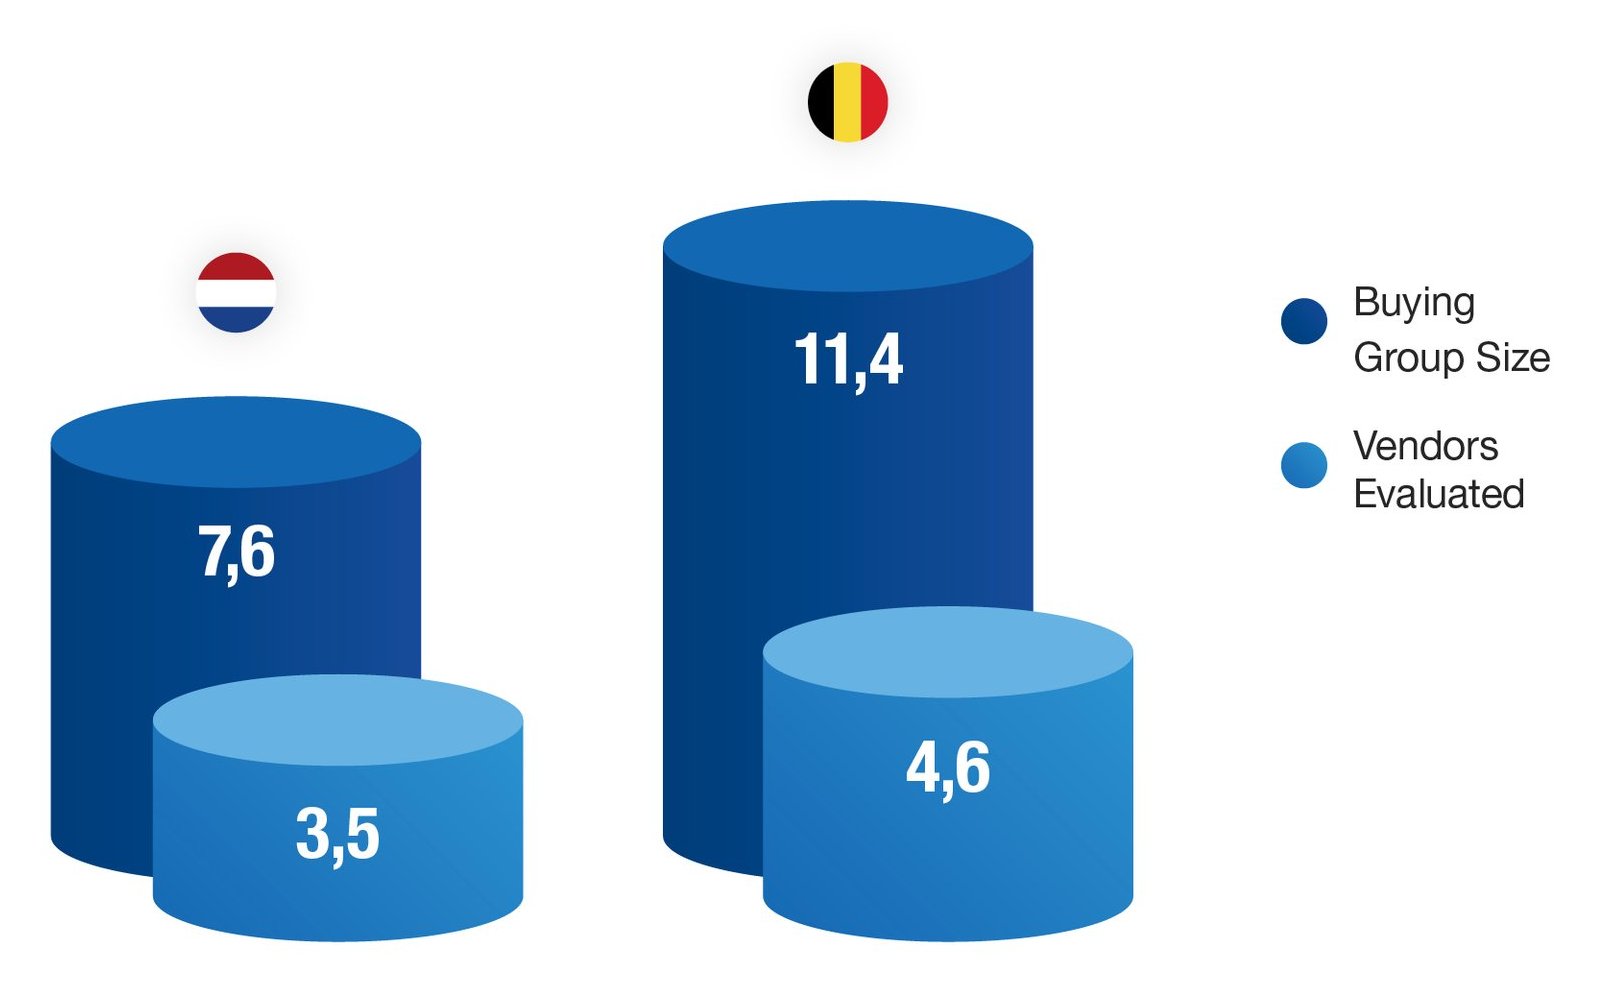
In turn, Dutch buying journeys tend to be shorter (8 months vs. 11.5 months) (Figure 5), involve smaller buying groups (7.6 people vs. 11.4 people) (Figure 6), and include fewer interactions per person, per vendor (12.5 vs. 16.3 interactions) (Figure7).
This suggests that Dutch buyers may have a higher tolerance for calculated risks by evaluating fewer options, opting for streamlined decision-making over complex, prolonged evaluation processes.
This is supported by Hofstede’s research mentioned earlier, indicating that the Dutch score lower on uncertainty avoidance than Belgians.